Data Portal Guide
Navigating the Data Portal
Learn more about Northern Water's data portal with details on stations, filtering and more. For additional guidance, visit Navigation Examples.
Note that clicking on all images opens them in full view.
Station Overview
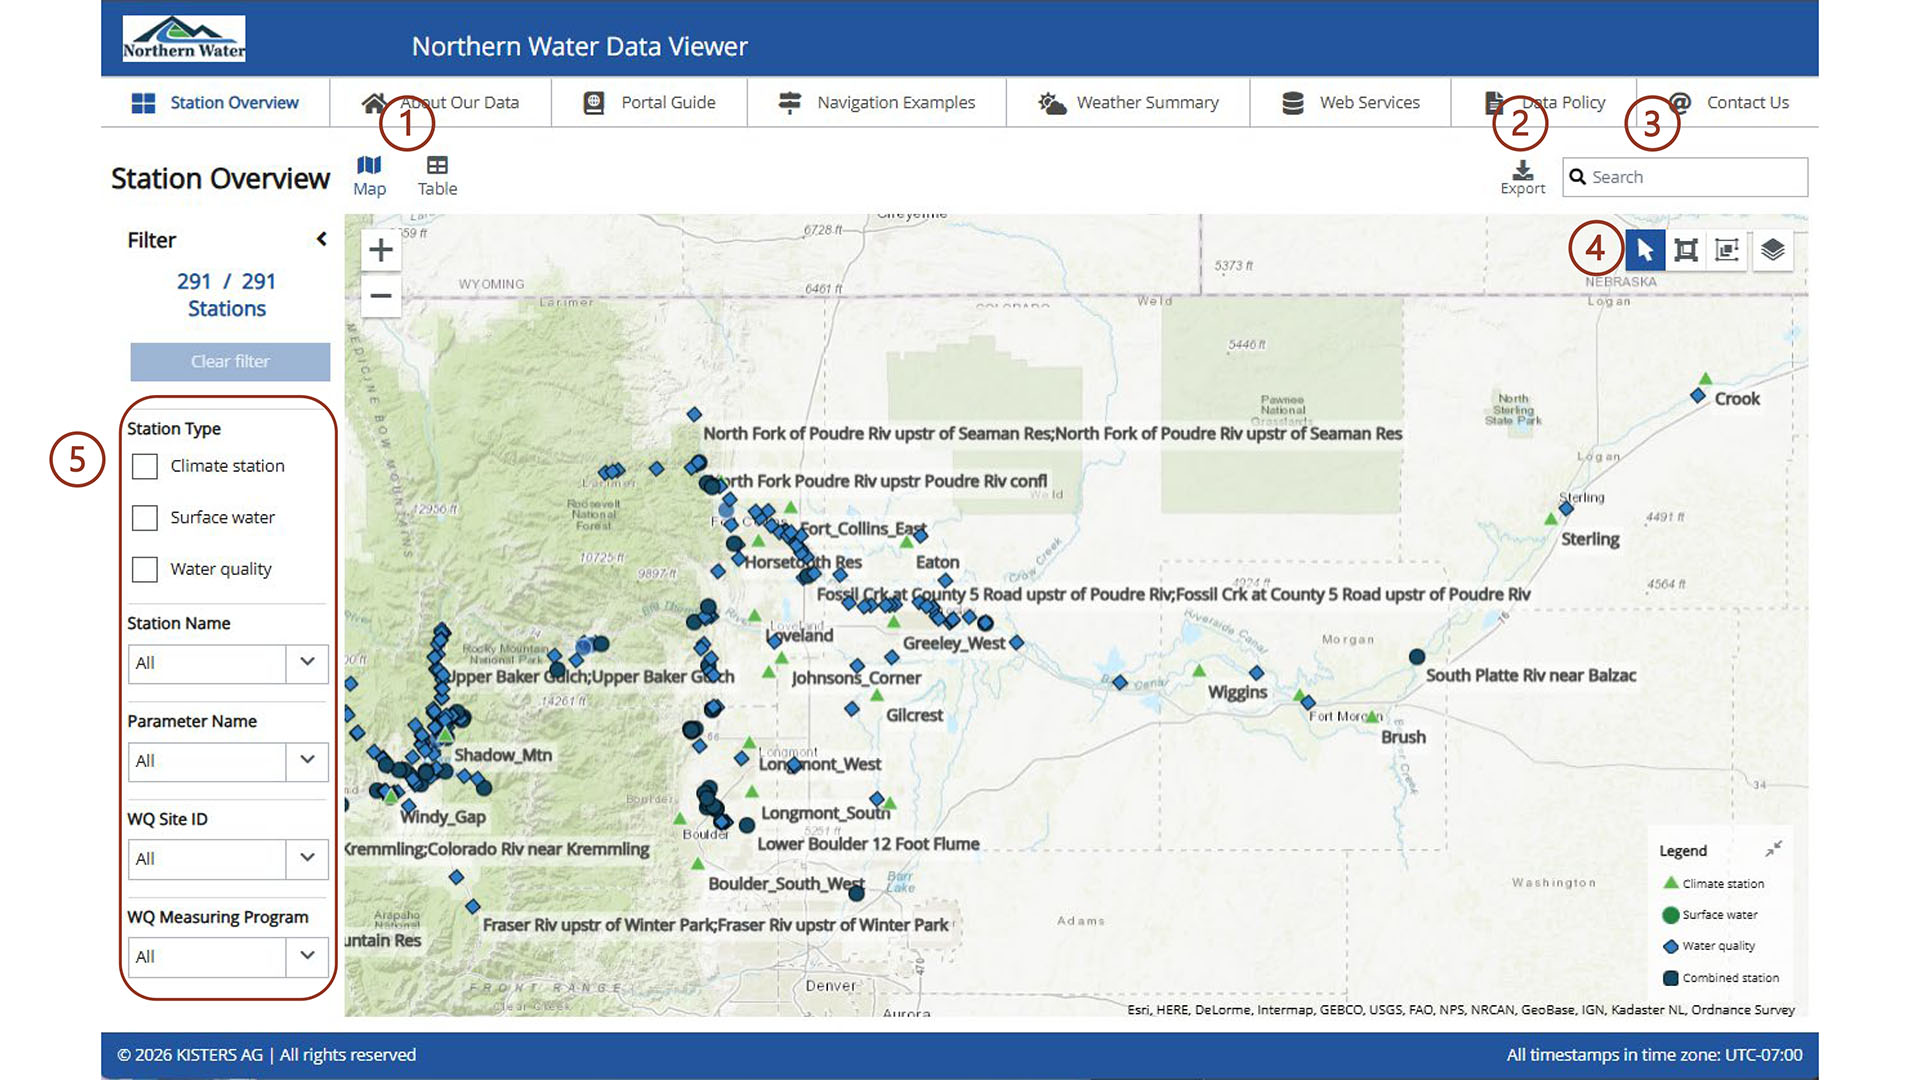
From the Station Overview page, there are navigation options.
- Select Map or Table to view stations through this filter.
- Select the Export icon to download station metadata in an Excel file. This file includes the unique station number, station name, available parameters, coordinates and types of data.
- A search bar next to the Export icon allows for direct searching on the Station Overview page.
- Within the map, in the upper right corner of the there is a Zoom/Pan, a Select by Rectangle, Select by Polygon and a Legend that gives overlay and base layer options.
- Both Select by options allow for a map based multi-select that selects by area. From the Table view a new Show only Selection button appears and filters the Table view to the map-based selection made.
Station Filtering
To locate data, use the filter panel (5 in the upper image) on the left side of the Station Overview page. These filters help narrow the list of stations to those that meet specific criteria. These options include:
- Station Type
- Climate Station: Represents weather stations used to generate the weather summary and calculate evapotranspiration for grass, turf and native stations.
- Surface Water: Primarily represents flow stations with discharge data. May also include telemetered parameters such as water temperature and turbidity.
- Water Quality: Primarily discrete water quality being sampled. May also include the telemetered parameters such as water temperature, turbidity and specific conductivity.
- Station Name
- Filter by the specific names used in Northern Water’s database to find stations.
- Station Parameter Name
- Filter by parameter to show stations for particular searches.
- Water Quality (WQ) Site ID
- Filter using Northern Water’s Water Quality identification (ID) names.
- Water Quality (WQ) Measuring Program
- Monitoring throughout Northern Water's system is managed through different programs that can filter the stations. Some stations may belong in multiple programs.
After applying filters, select a station by clicking its icon on the map or clicking the box on the left side of the main window in the table view to view available data.
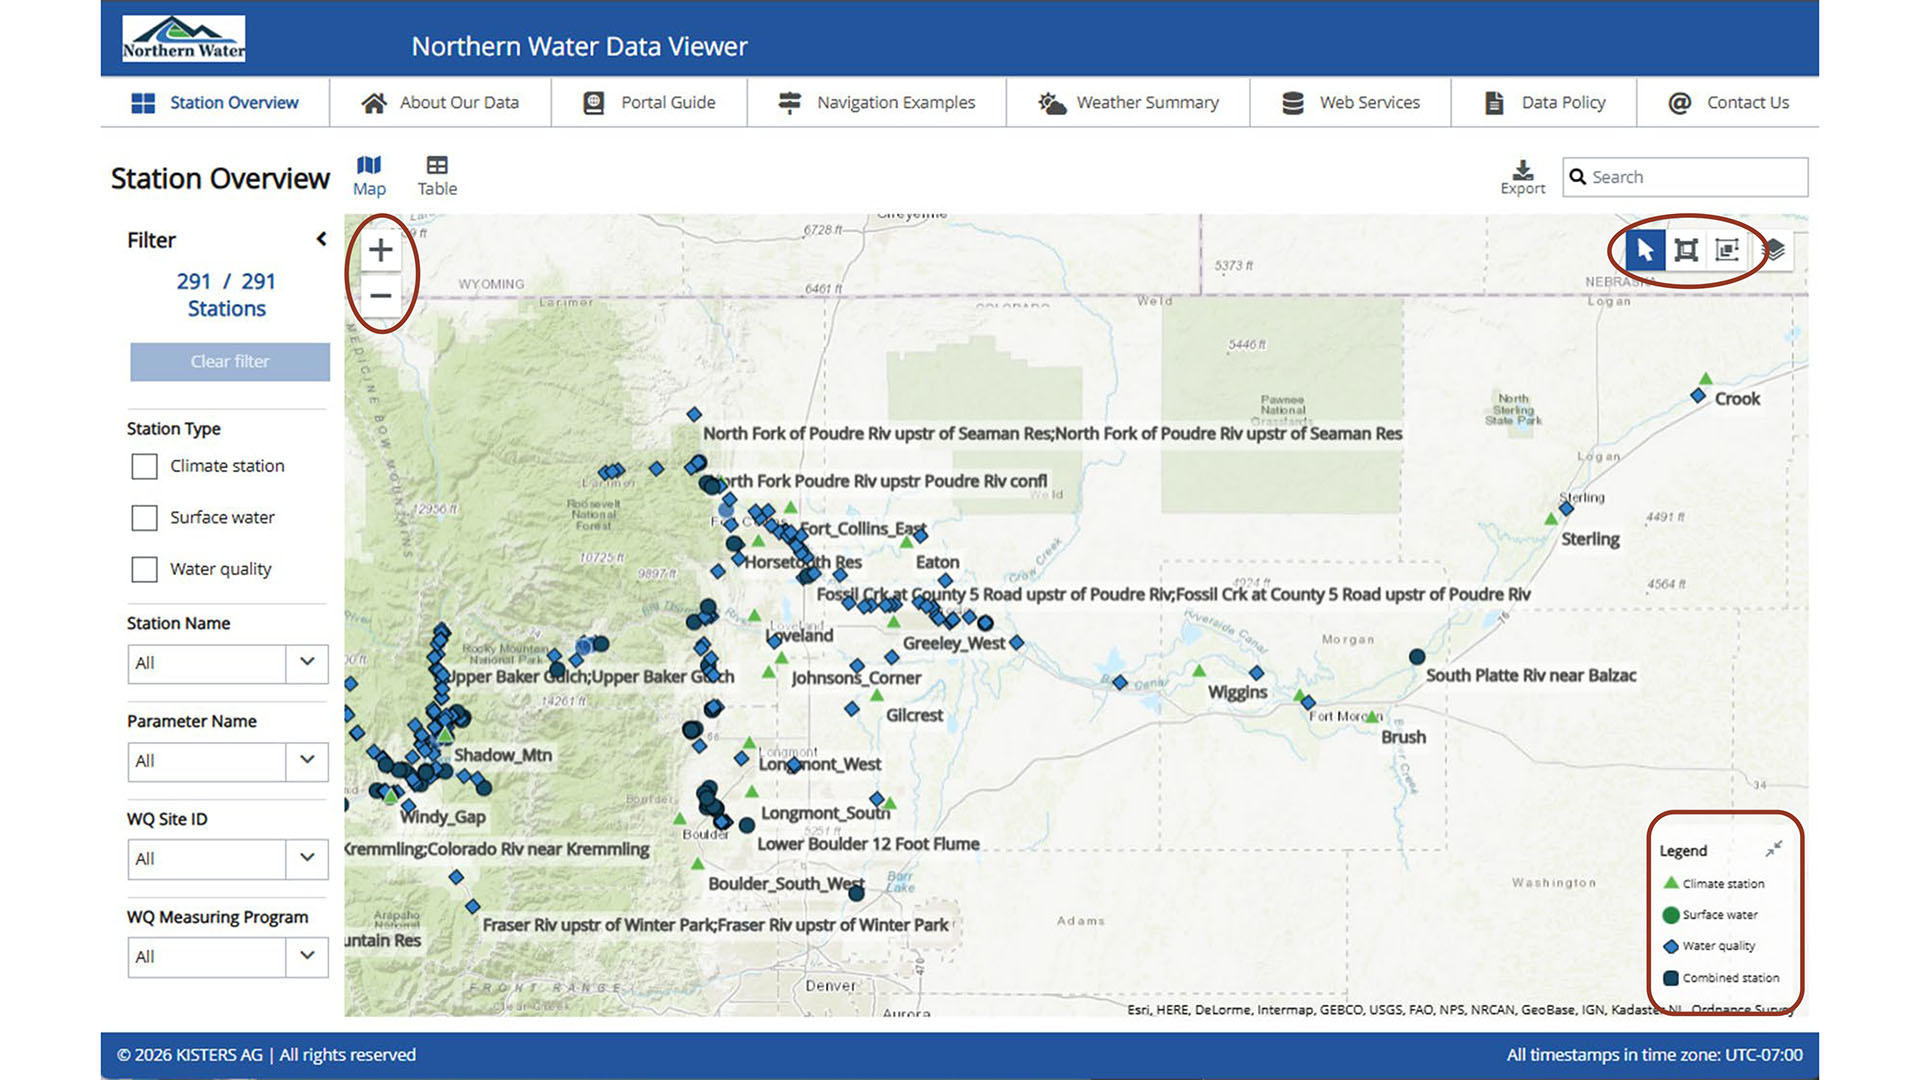
Map Window
Within the map, there is +/- arrow in the upper left corner. At broader zoom levels, some station names may not appear; zooming in will reveal additional labels. In the upper right corner of the there is a zoom/pan, a select by rectangle, select by polygon and a legend that gives overlay and base layer options. There is a legend that can be expanded in the bottom right corner that includes the symbols used in the station type filter panel. Note how many stations are both surface water and water quality station and are identified as combined stations.
Locating Data
Once a station is double clicked, its available datasets appear in a popup window. For more examples, please visit the Navigation Examples page.
- In the map view, you can toggle between Time Series (Surface Water category parameters) and Water Quality (Discrete) (Water quality parameters). All parameters of the type will populate in the lefthand panel, and the main window will have the graph.
- In the table view, you can check multiple station boxes and Time Series in the top ribbon to have all of their time series appear. More than one station can be graphed on one plot.
Instructions for graphing datasets in either view include:
- When data is available, there will be a data range in the From and To columns. There is no data available if these field are blank.
- To view the data, select the graph icon.
- Date ranges can be customized by the default icons (3d, 10d, 1m, etc.) or by selecting a custom date range above the graph.
- Data can be exported by selecting the export icon at the top right corner of the graph and choosing your desired format (csv, xlsx, html, json, plain text, etc.)
- The graph can be saved as an image by right clicking on the graph and selecting Save picture as from the list.